Product updates

Performance improvements to Google Sheets widgets

We’ve upgraded our Google Sheets data source, making it a whole lot easier to keep your Google-Sheet-powered widgets up to date. First and foremost, we’ve changed the way we pull in data from a Google Sheet; instead of automatically updating every 15 minutes as before, each widget will now update within three minutes of a change to your spreadsheet.

This applies to all Google Sheets widgets, apart from those that rely on pivot tables or IMPORT functions, such as IMPORTDATA. Those will continue to refresh every 15 minutes, however it’s now no longer necessary to use a script or other workaround to get these to work in Geckoboard. Just set up your widget the way you want it and our automatic refresh will do the rest!
Mobile-friendly view

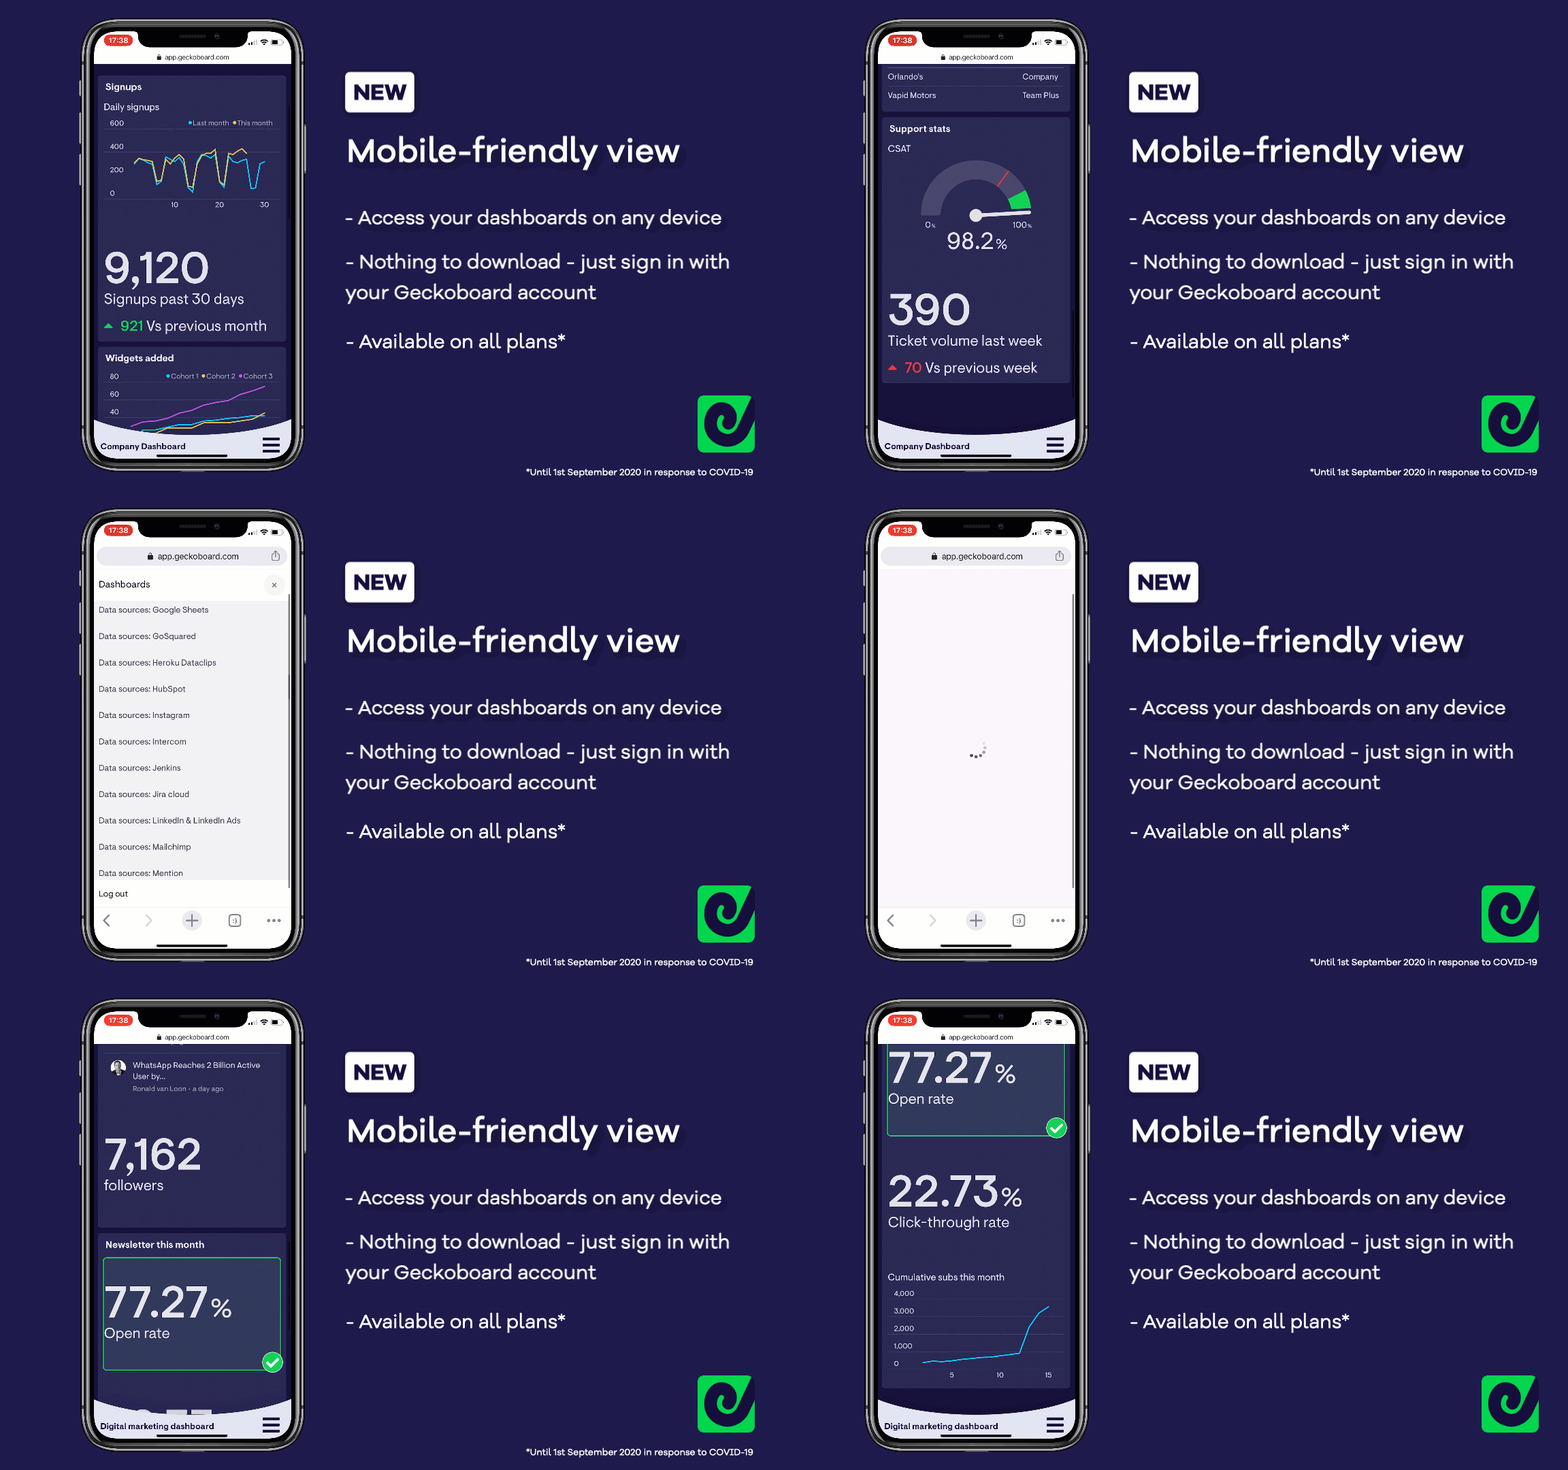
mobile-friendly-view.gif

Log in to your Geckoboard account using the web browser on your phone, and your dashboards will now be perfectly formatted to fit the screen you’re using - ideal for accessing your metrics when you’re away from the office.

All your widgets, groups, status indicators and goals that you’ve set up on your desktop view will be displayed on your mobile-friendly dashboards, and you can easily browse the dashboards on your account by tapping the icon in the bottom right.

A few things to note:

  • Dashboards will be read-only when accessed through a mobile browser. To add or edit dashboards, switch to a desktop browser.
  • Mobile-friendly dashboards are available on Team plans or above, however as part of our response to the COVID-19 crisis we are making this available on all plans until 1st September 2020

Status indicators and number formatting on new dashboard layouts

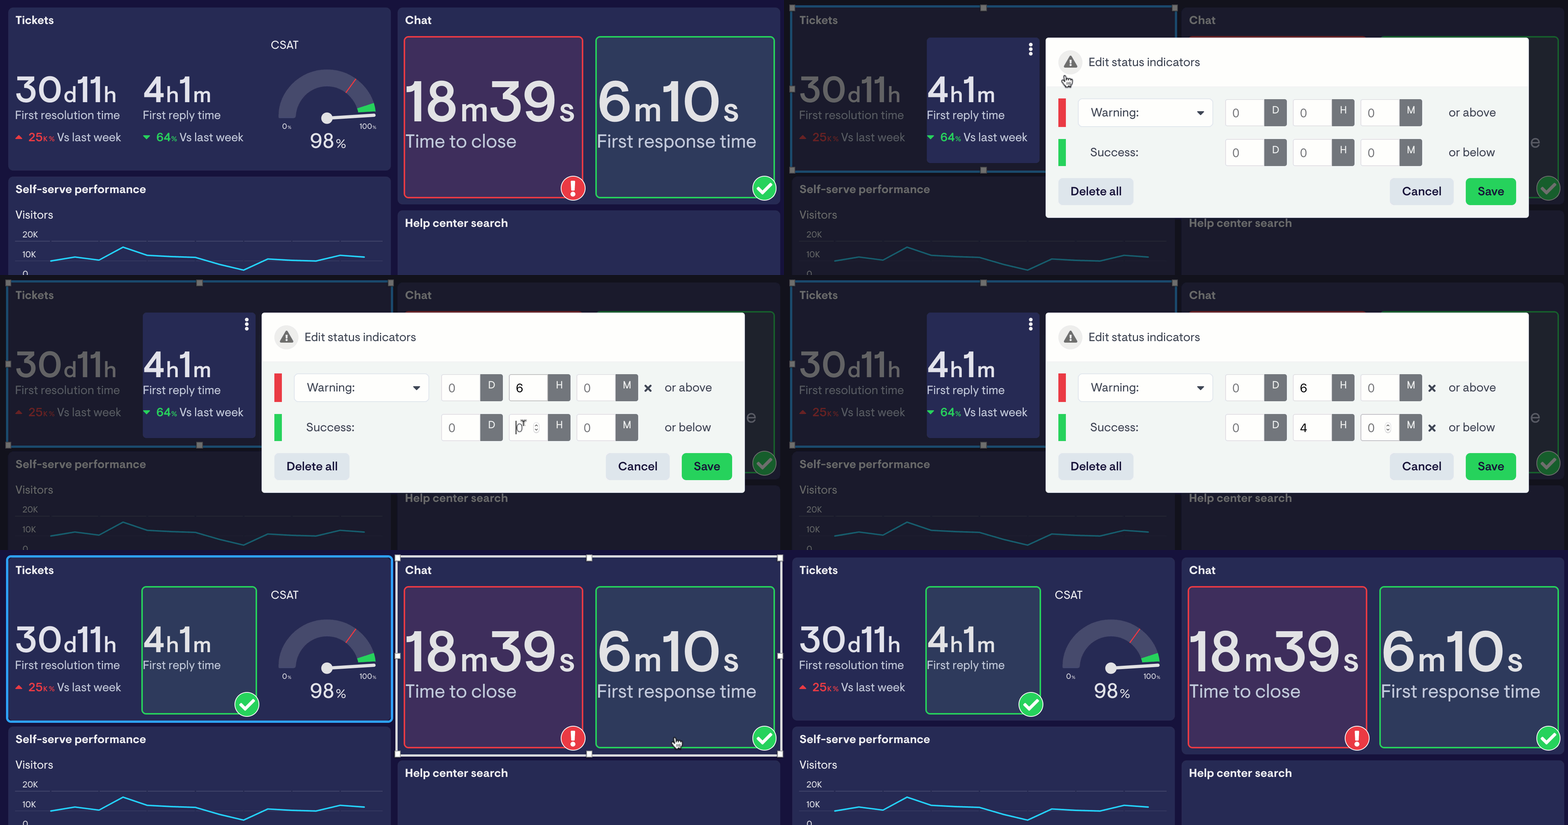
It’s now possible to add and edit status indicators on our new dashboards, to automatically flag to your team when a number is performing particularly well or poorly.

To add a status indicator, click the top right of a widget, select “Add status indicator”, and set a value for when the widget should show a ‘warning’ or ‘success’ state.

status-indicators-new-dashboards-geckoboard.gif

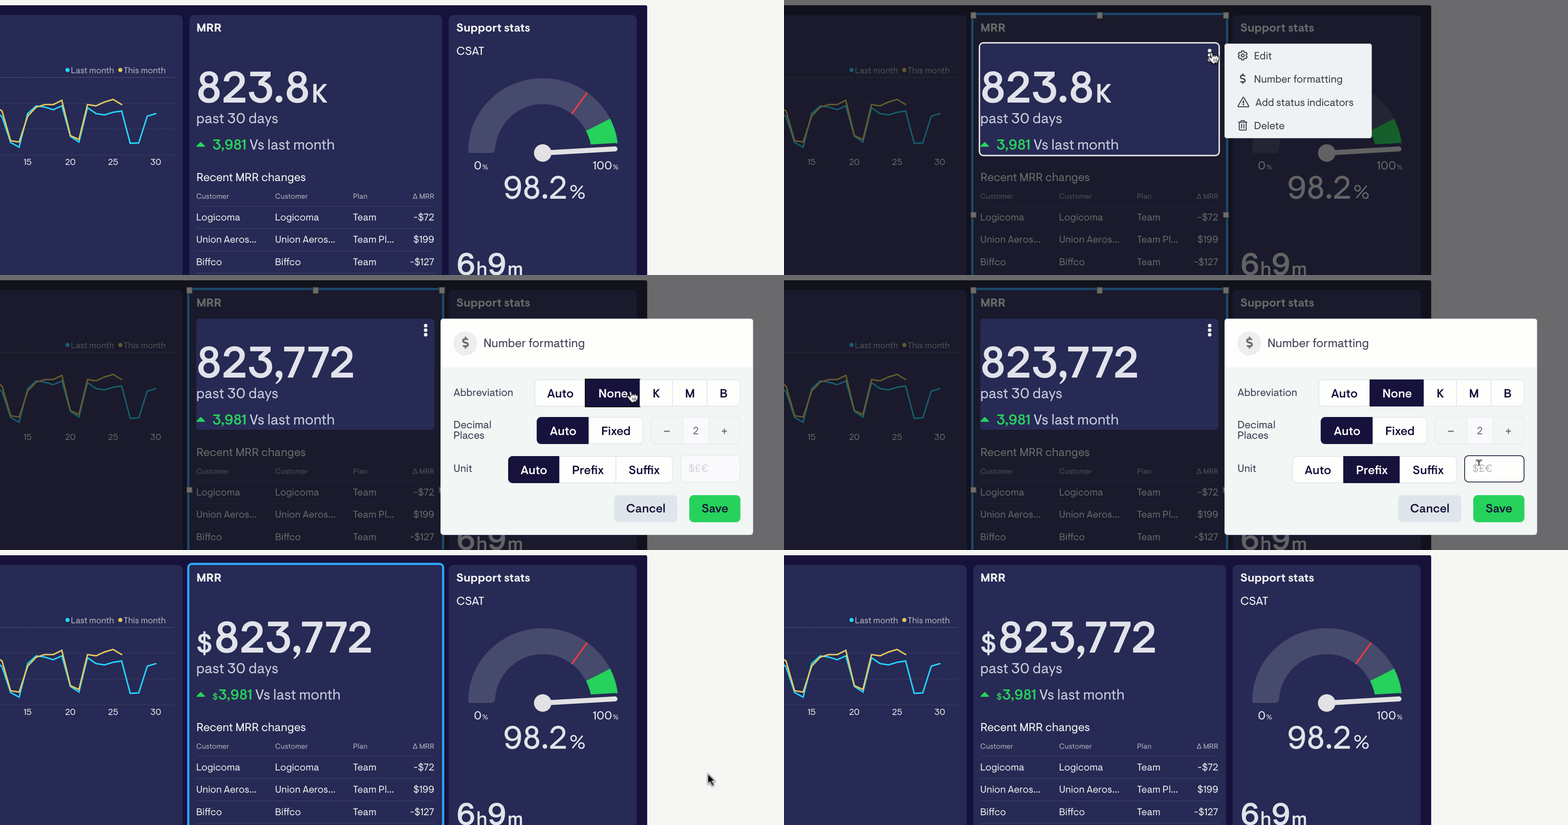
This update also allows you to adjust number formatting from within our new layouts, making it quicker and easier to display numerical data just the way you want.

number-formatting-new-dashboards-geckoboard.gif

Enhanced Mixpanel widgets

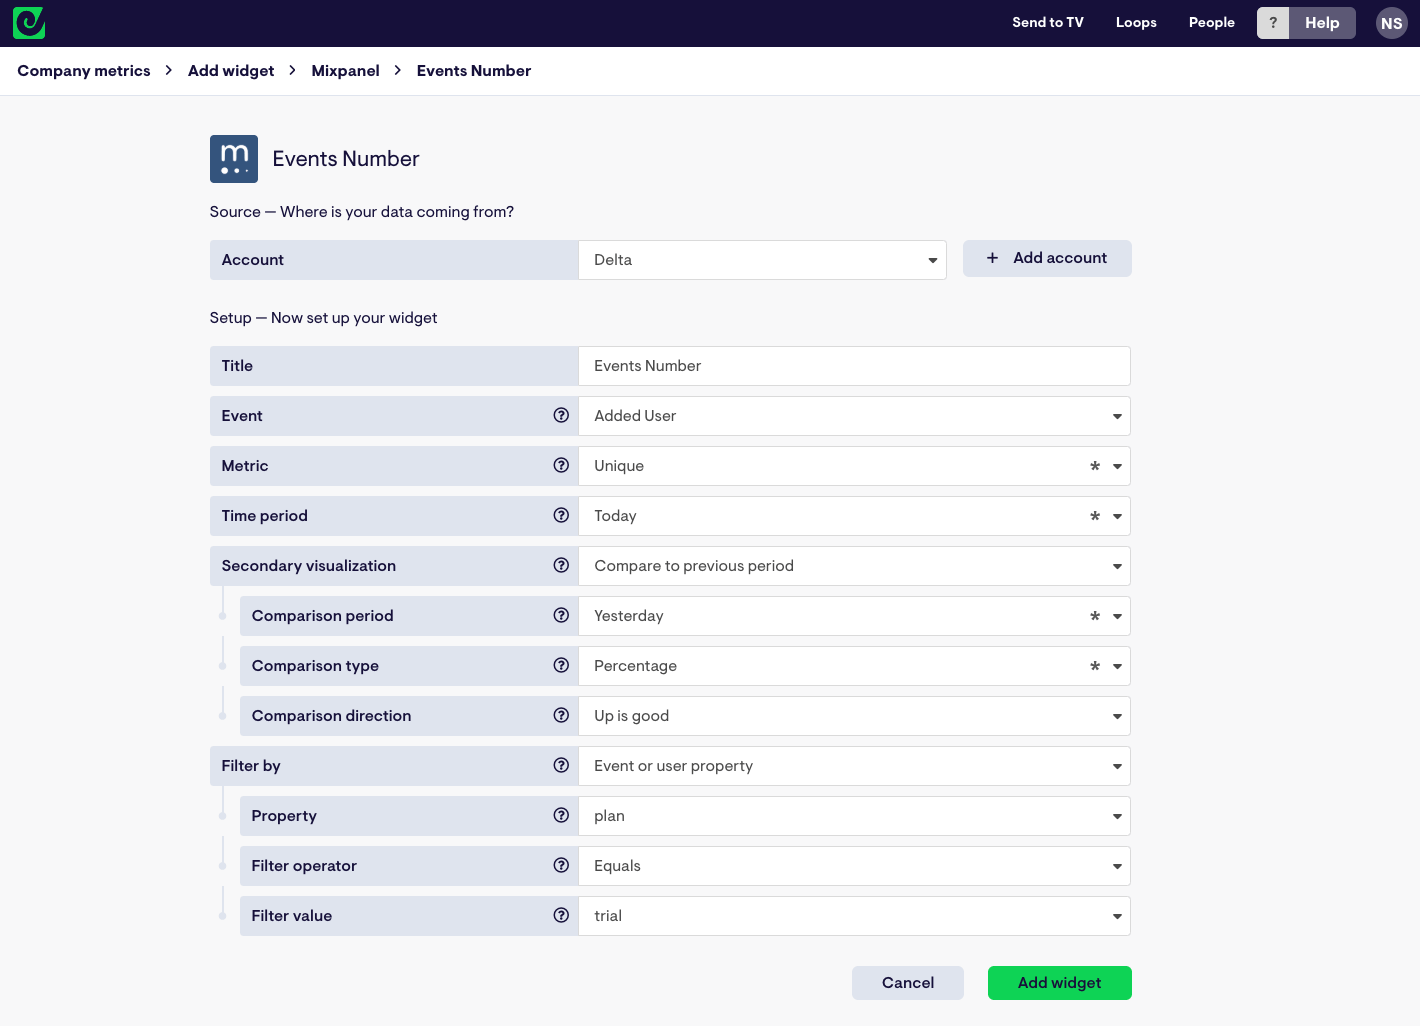
We’ve remodelled several of our Mixpanel widgets, making it possible to access more metrics from your Mixpanel account, as well as adding user property filters and improving data accuracy.

Here’s a breakdown of what’s changed:

  • New Funnel Completion Number widget that supports Funnel Completion Rate, and adds Drop-off Rate and Unique Funnel Completions
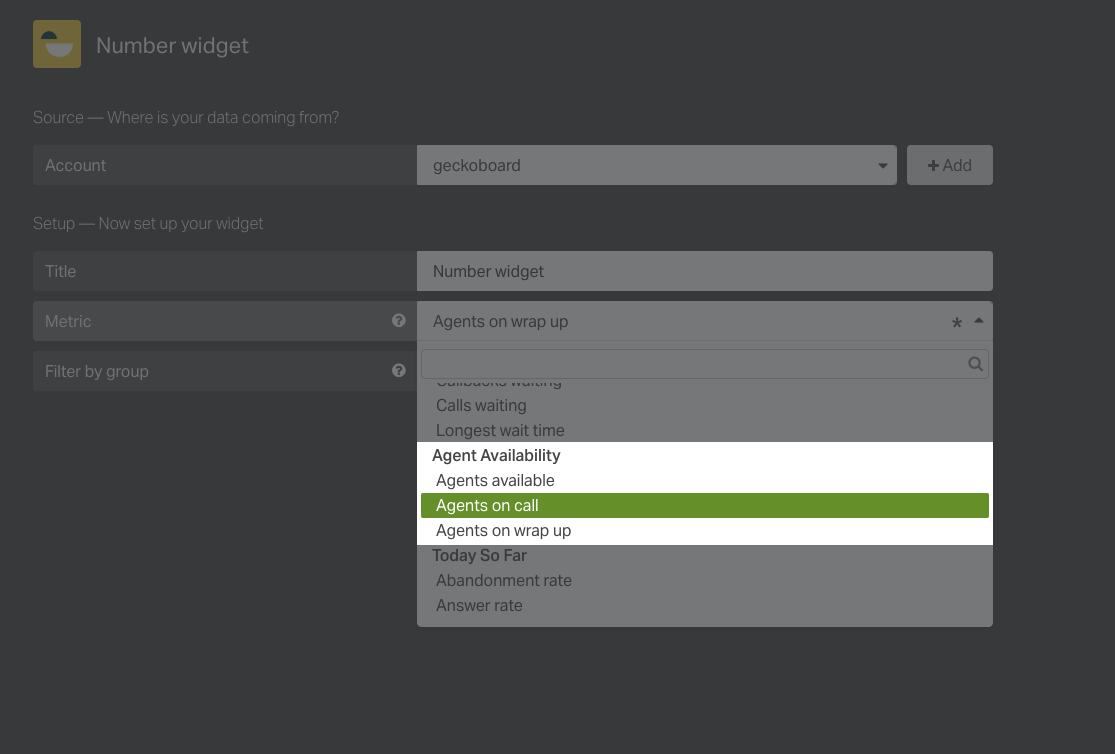
  • New Events Number widget with stronger support for custom events, and now user property filters
  • More organized setup experience
  • Support for more filter operators, such as ‘does not equal’ and ‘is between
  • Improved data accuracy, particularly for custom events and averages
  • Added ability to define whether an increasing number is ’good’ or ‘bad’

geckoboard-mixpanel-events-number.png

The all new Geckoboard

gb-launch-blog-white.gif

After months of hard work behind the scenes, we’re incredibly excited to release a huge update to Geckoboard to kick the year off with a bang! Here are the highlights:

New dashboard layouts

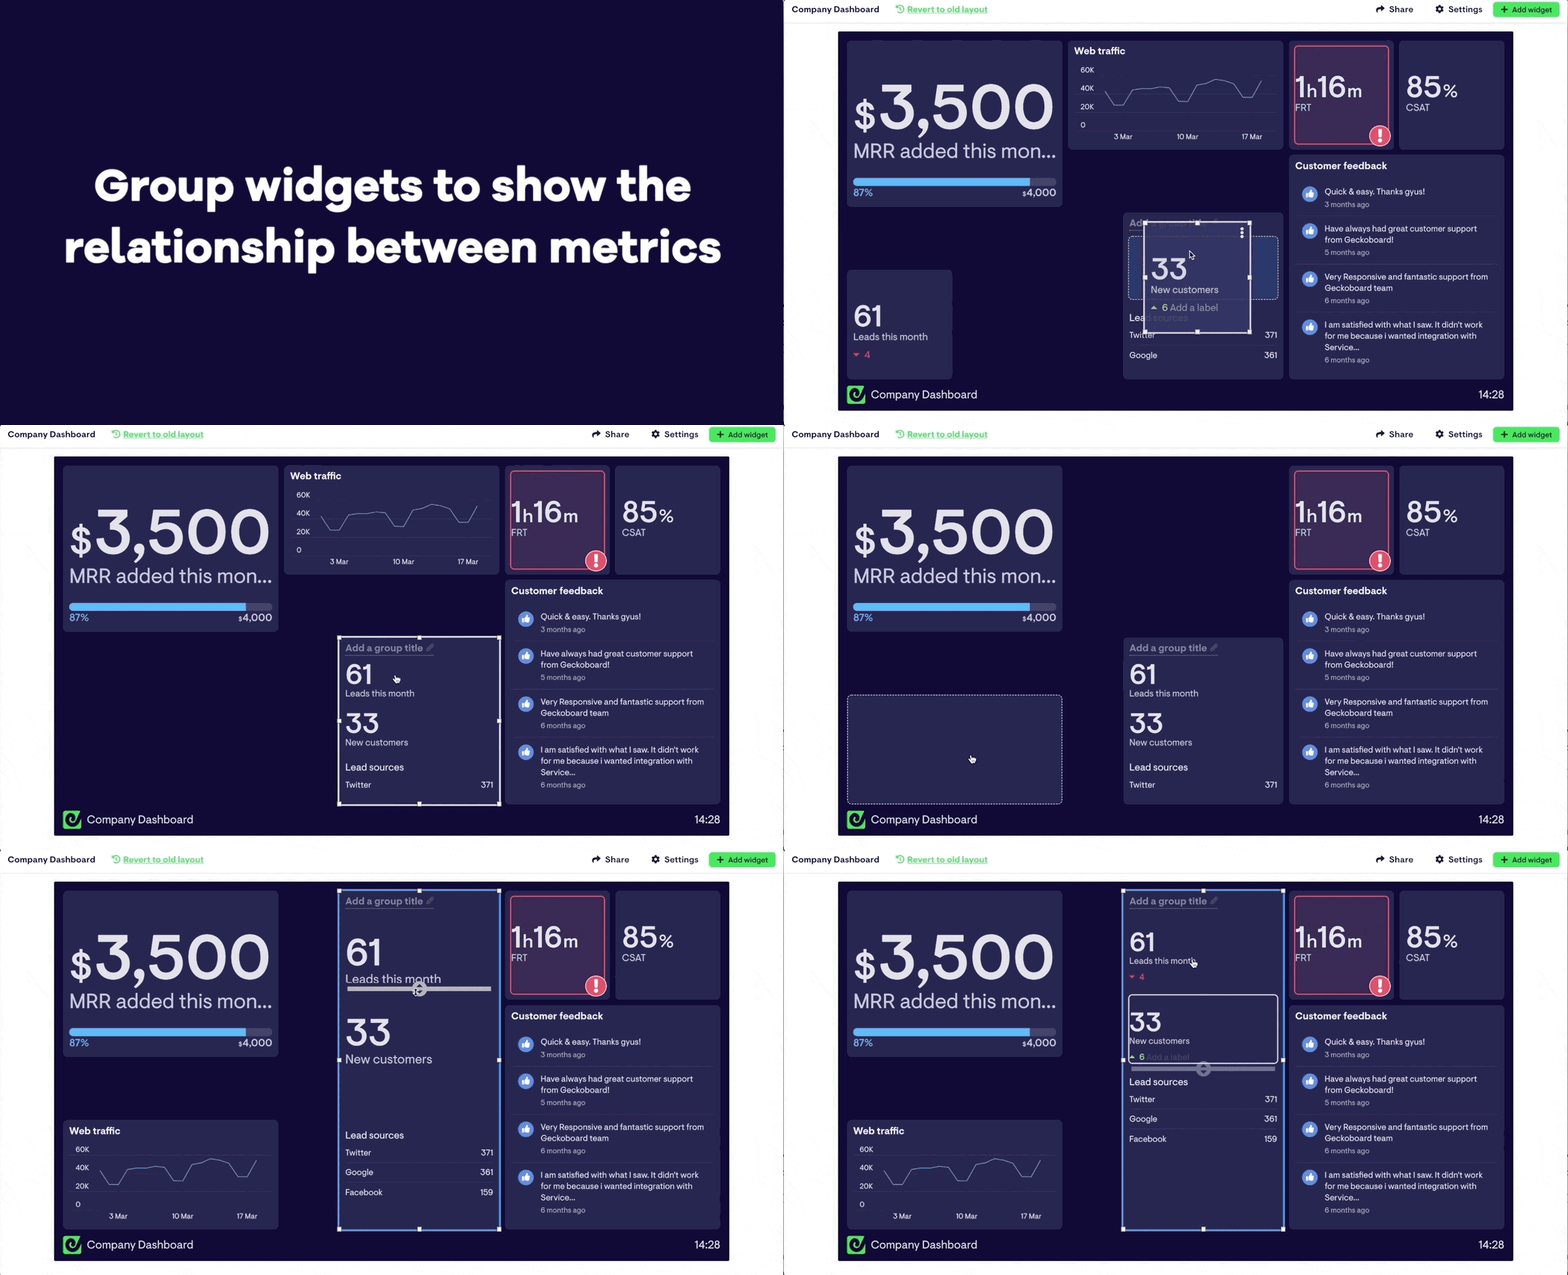
Our new dashboard layouts make your key metrics clearer and easier to understand than ever before. Widgets can now be grouped so you can show how metrics relate to each other, and you can make better use of space on your dashboard by labelling groups of metrics.

geckoboard-groups.gif

To learn how to convert your dashboards to use the new look, check out our help article.

Redesigned visualizations

We’ve redesigned key visualizations and indicators to make them even easier to read at a distance.

Fresh new design and brand

Our dashboards have been updated with a bold new design that improves legibility and makes them more engaging for your team. We’ve carried this through to our website and help center with a complete rebrand that we hope you love as much as we do.

Timespan filters

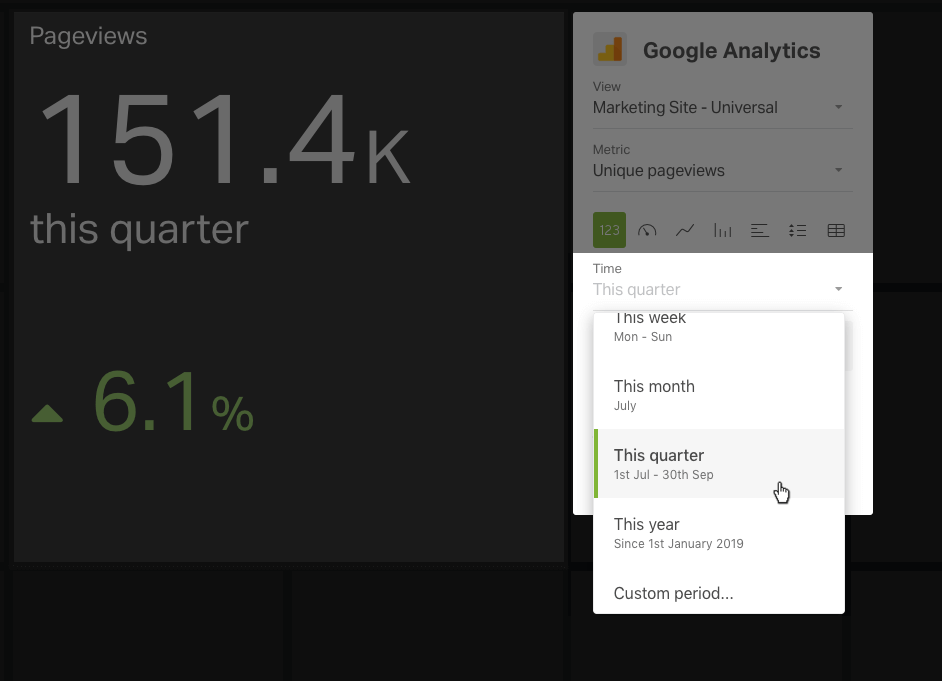
We’ve made it easier to track performance throughout a business cycle by improving timespan options on certain integrations. You can now display data for the current calendar quarter or year-to-date, and also compare performance to the previous period on the following integrations:

  • Freshdesk
  • Google Analytics
  • Pipedrive
  • HubSpot (Beta)
  • Facebook Ads (Beta)

new-dashboard-timespans-geckoboard.png

This update opens up a range of possibilities that make your dashboards even more useful for communicating progress:

  • Visualize performance against a quarterly sales target
  • Show customer support performance for the year-to-date
  • Compare the current quarter to the same quarter last year (ideal for businesses affected by seasonality)
  • Compare today’s performance to the same day last week
  • Compare the current month’s performance to the same month last year

Access these new filters simply by adding or editing a widget powered by one of the integrations above.

Google Analytics integration

We’ve rebuilt our Google Analytics integration from the ground up to make visualizing data from your Google Analytics account easier than ever before. Here’s a rundown of what’s included in this update:

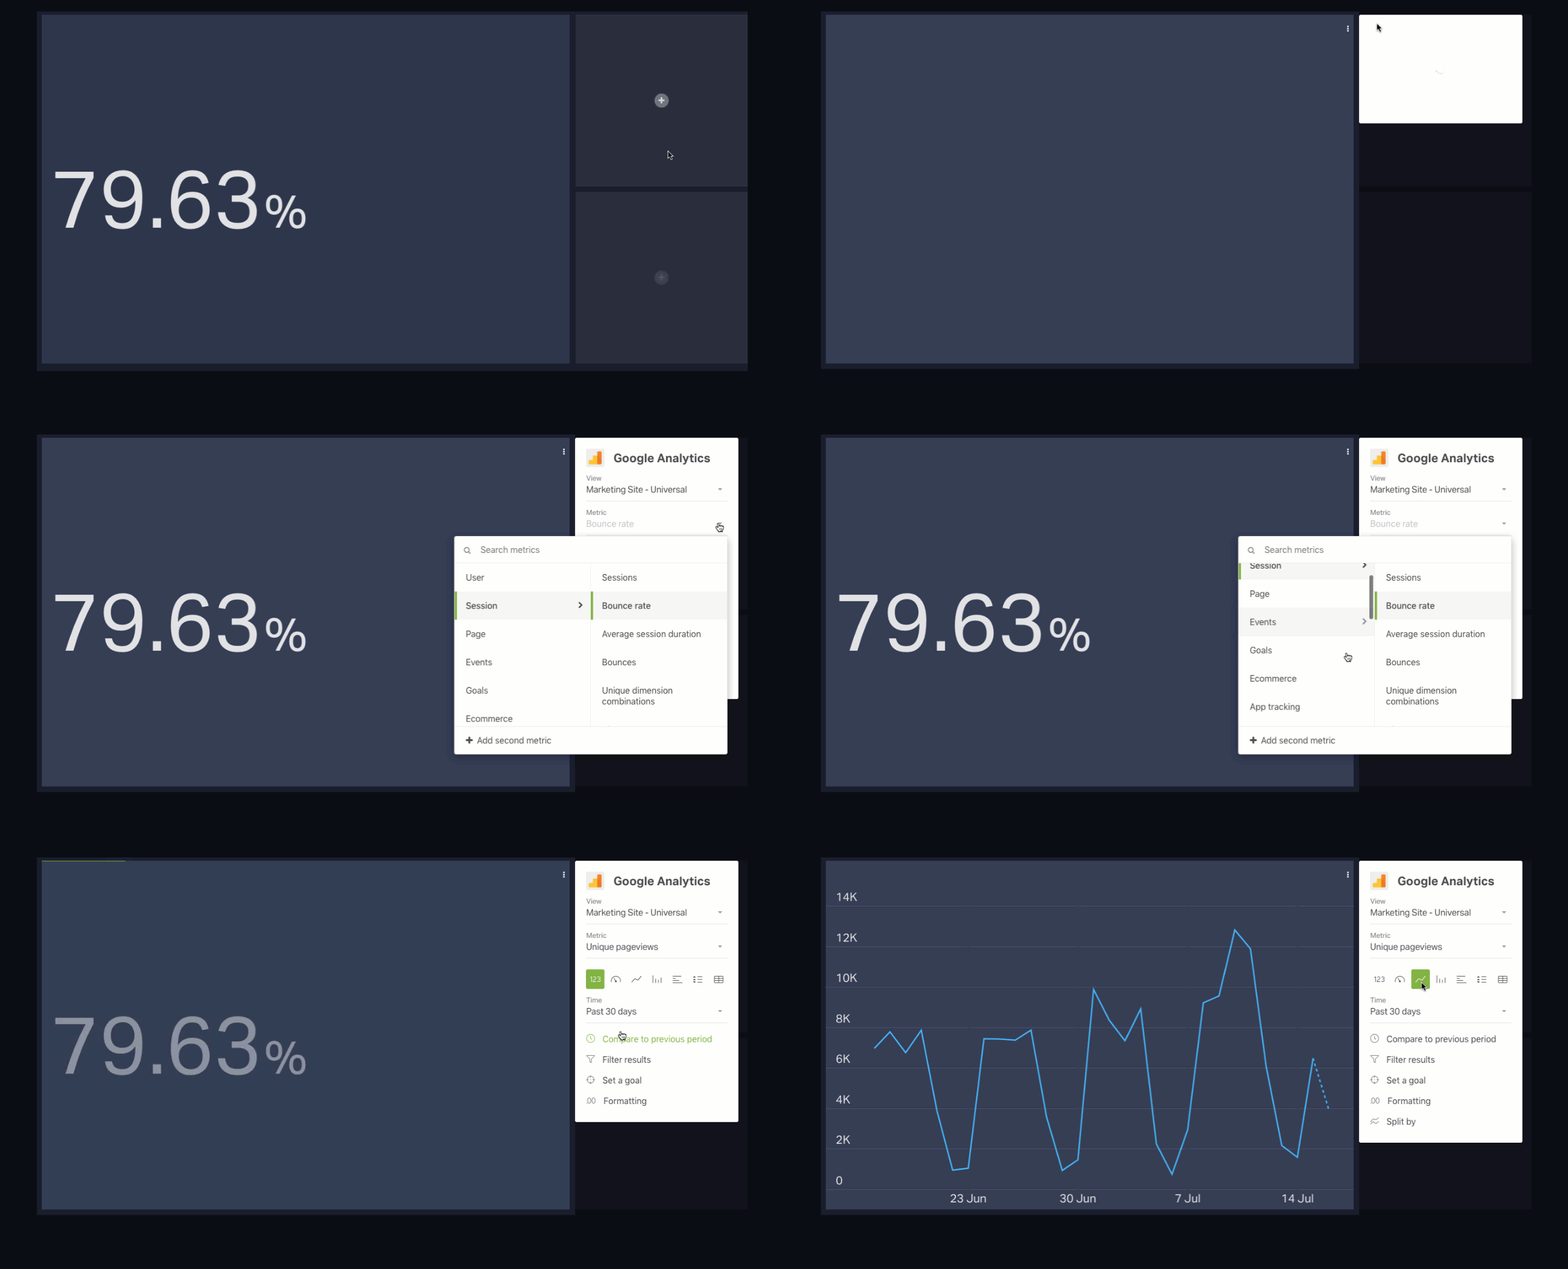
  • Build and edit Google Analytics widgets faster with a brand new interface that allows you to configure your widgets from your dashboard, and easily switch between GA accounts and views
  • Quickly visualize popular metrics from Google Analytics across seven different visualizations, using a range of one-click presets
  • Access all your metrics from Google Analytics, including custom metrics and goals, as well as GA-enabled metrics for AdWords, AdSense, Ad Exchange, DoubleClick Campaign Manager, DoubleClick for Publishers, DoubleClick Bid Manager and DoubleClick Search
  • Improved comparison visualizations
  • Improved filtering options, including the ability to add multiple filters and use custom strings
  • Add goals and status indicators to highlight when a metric hits a certain range
  • Smarter widget updates for improved reliability on accounts with many Google Analytics widgets

geckoboard-google-analytics-update.gif

Try the new integration out by logging in and adding Google Analytics widget - we’d love to know what you think!

Intercom integration

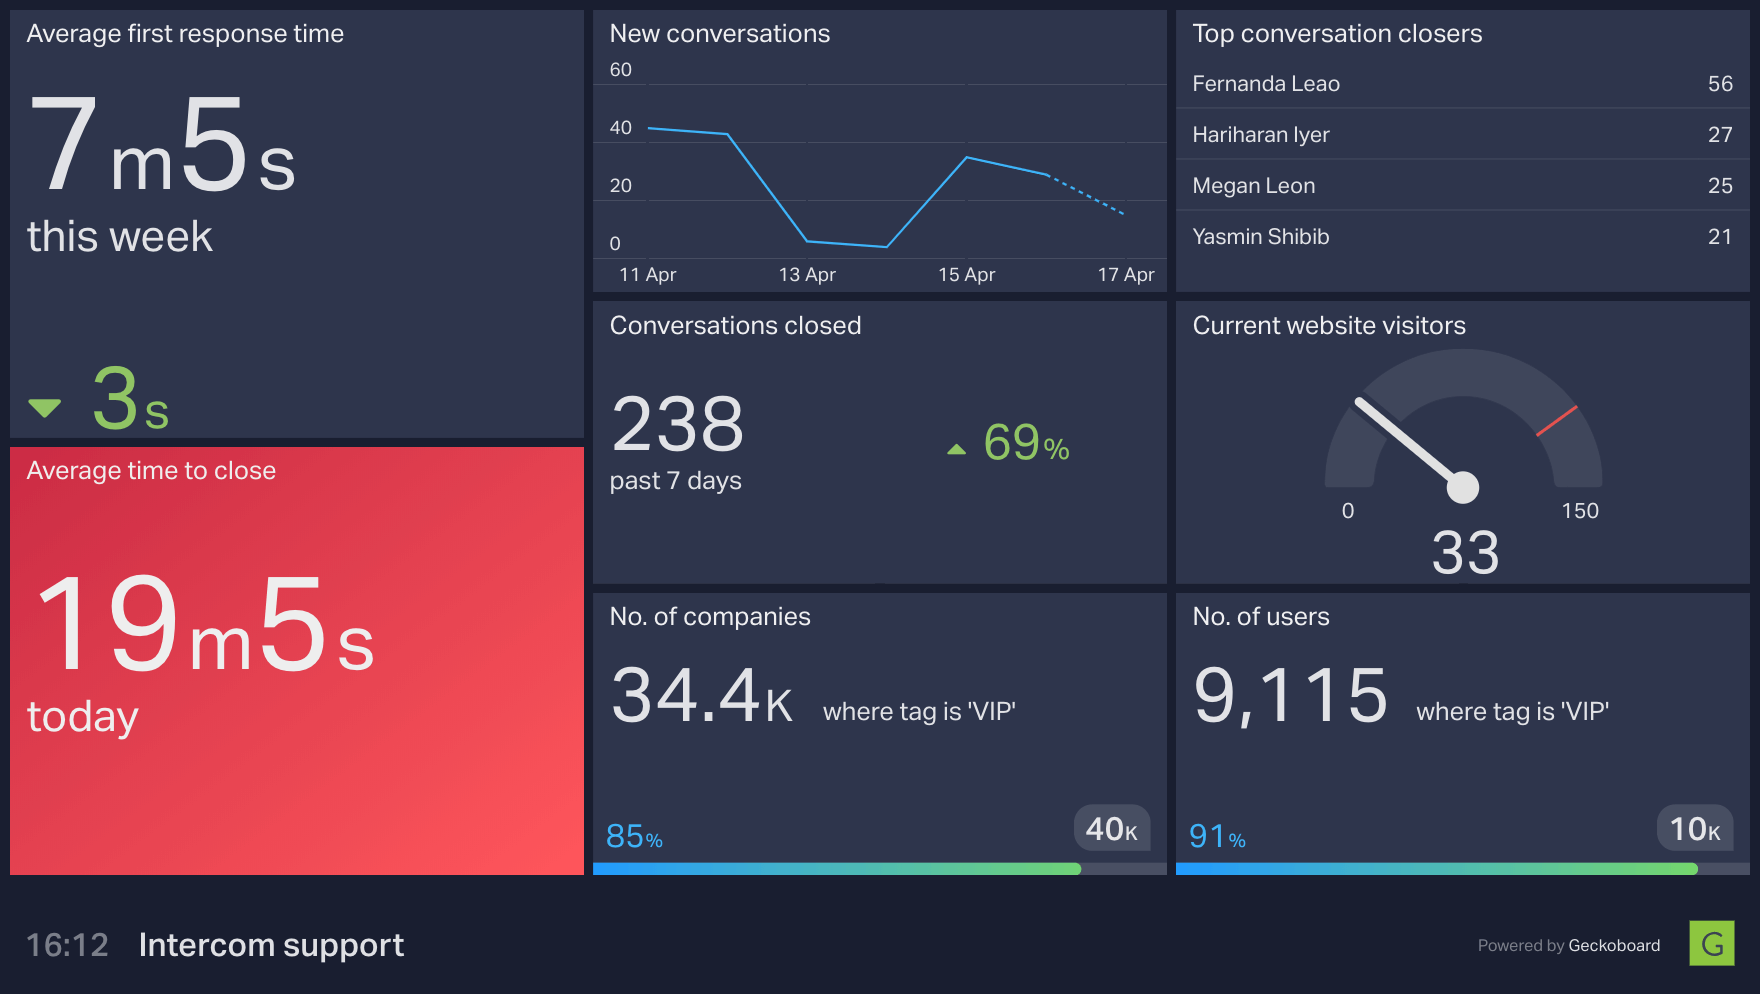
We’ve launched some big improvements to our Intercom integration! Our overhauled integration makes it easier than ever for support teams using Intercom to keep track of their progress, stay motivated, and react quickly to problems by displaying the metrics that matter on a big screen.

Connect your Intercom account to Geckoboard and you’ll now be able to visualize the following metrics:

  • First response time
  • Time to close
  • New conversations
  • Number of users
  • Number of companies
  • Number of leads

Depending on the metric, you can now also filter by assignee, state, segment and tags to make your visualizations even more relevant to your team.

interdom-metrics-dashboard

For more information on how the integration works, check out our support docs!

SQL databases integration

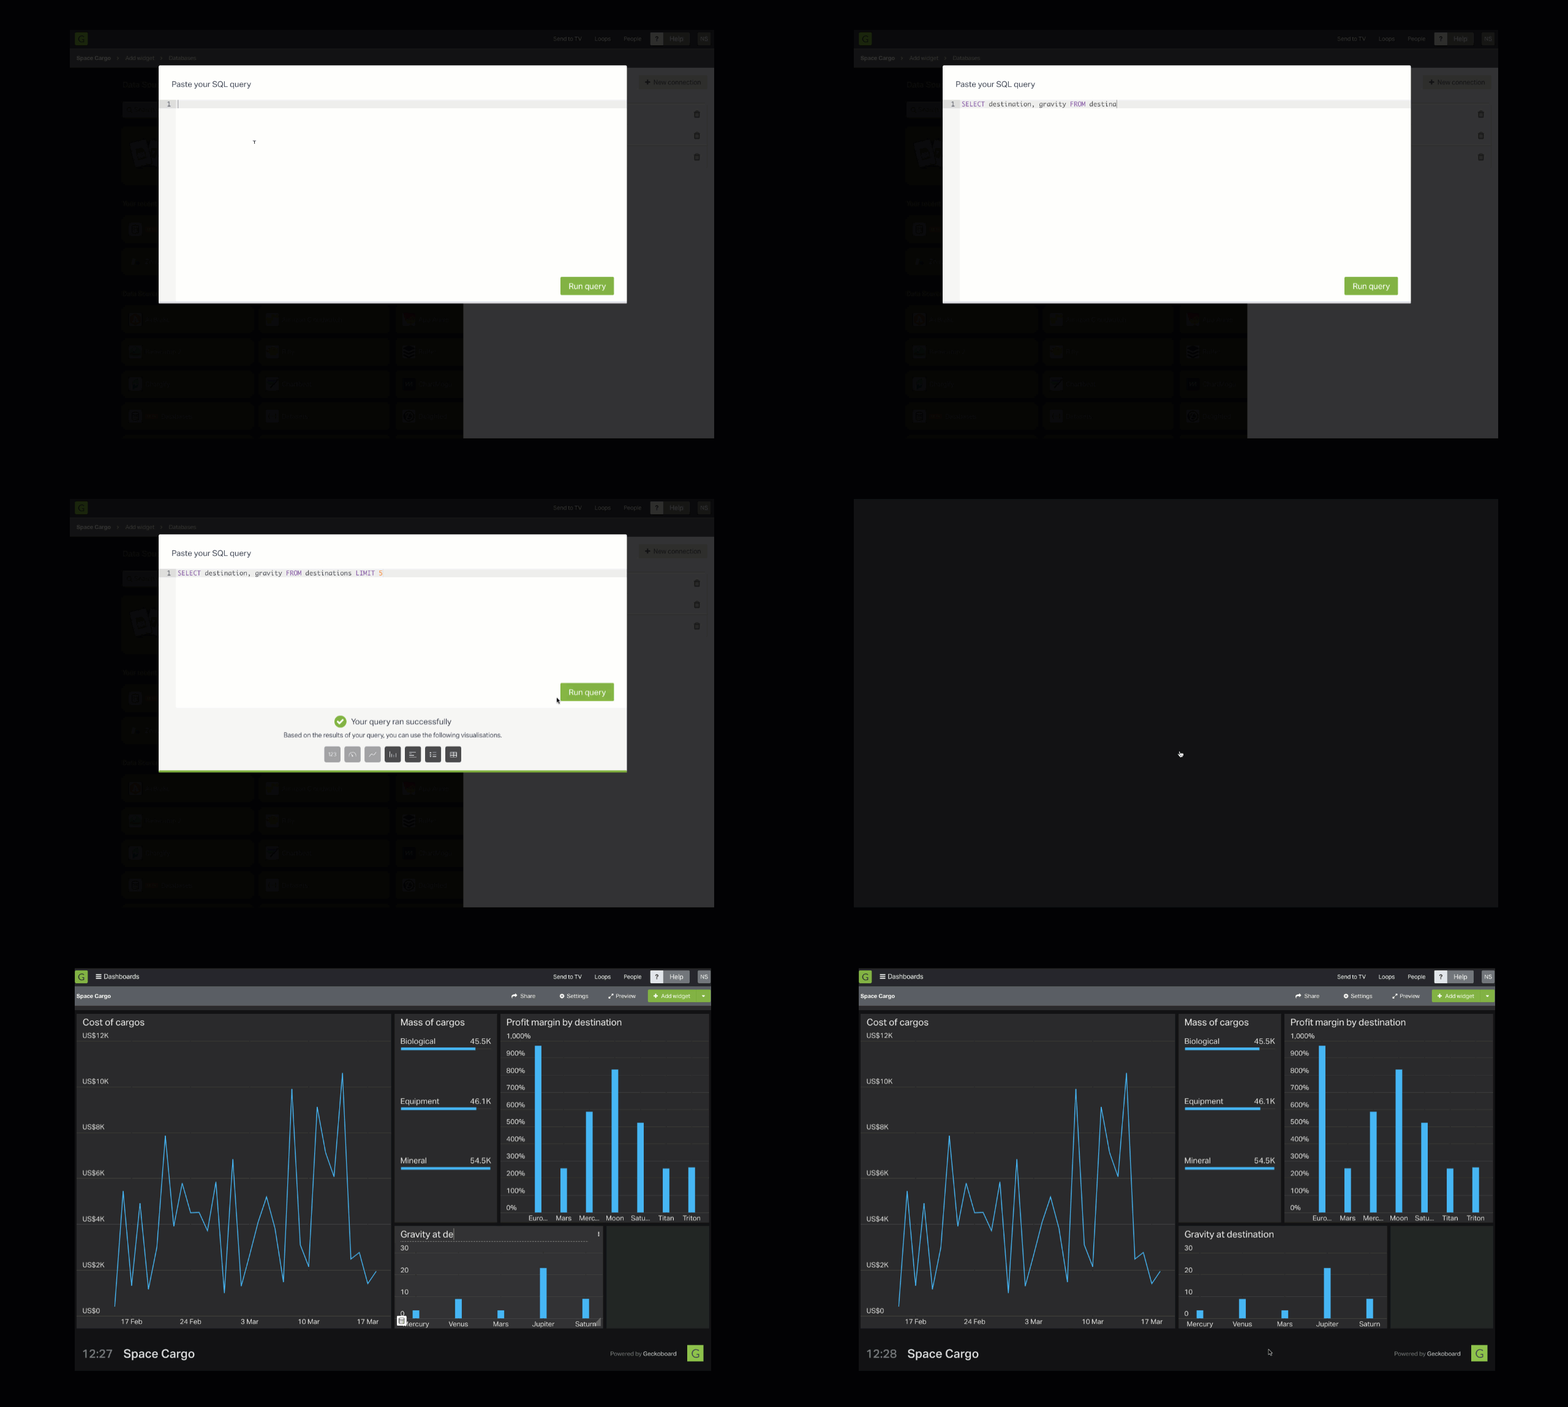
Getting important numbers out of a database and in front of your team can be a pain, especially if those numbers update frequently. That’s why we’re excited to launch our new [SQL databases integration](https://www.geckoboard.com/product/data-sources/sql-database-dashboards/ for MySQL, PostgreSQL and Redshift databases, available today on Team and Company plans!

db-widget

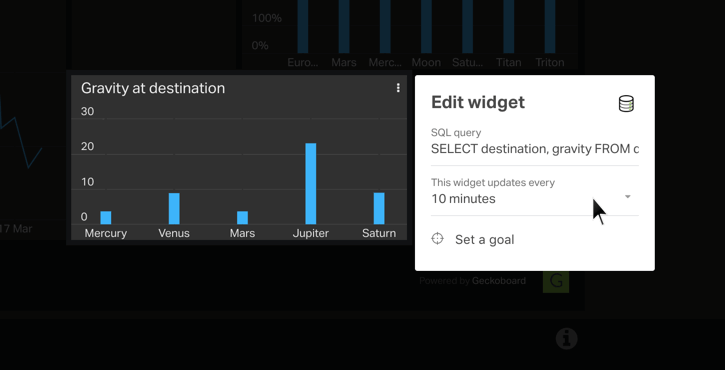
With your visualizations set up, we’ve made it so you’ll never need to go in and edit them again (unless you want to of course). Your visualizations will refresh automatically in the background to show up-to-date data without you needing to do anything. We’ve even given you control over how frequently they fetch new data.

sql-databases-dashboard-interval

For more information on how it works, check out our documentation, or give it a spin yourself!